
Explore Yelahanka's property price appreciation trend, driven by infrastructure, employment, limited land supply and long-term growth across North Bengaluru.
The Yelahanka property price appreciation trend through 2026 makes it the sharpest performer in North Bengaluru, at roughly 21.5% year on year. That is a headline worth interrogating rather than celebrating, because a single year tells you almost nothing about whether the next five will repeat it.
The Five-Year Picture
Zoom out and the belt's direction becomes clearer than any annual figure. Villa rates across the airport corridor moved from roughly Rs 4,200 a sft in 2019 to about Rs 12,000 now - close to a trebling across six years. Devanahalli ran from about Rs 5,500 a sft in 2020 to Rs 11,000-13,000 in 2026, compounding near 13.5% annually and posting roughly 19.8% in the most recent year. Yelahanka apartments now range about Rs 6,500-13,000 a sft.
What Actually Drove It
Three things, in sequence rather than in parallel. Kempegowda International Airport landed and Terminal 2 later widened capacity, which anchored the corridor permanently. Roads followed - Bellary Road grade-separated for much of its length, with the Satellite Town Ring Road adding regional connection. Employment migrated afterwards, towards the KIADB Aerospace Park, Devanahalli Business Park and the global capability centres that now populate the belt. Housing demand was the consequence, not the cause.
North Bangalore Capital Appreciation in Context
Compare across the belt and the dispersion is instructive. Jakkur sits near Rs 9,000 a sft. Bagalur, further out, sits nearer Rs 4,000. Devanahalli occupies Rs 11,000-13,000. That spread has widened rather than closed over five years, which tells you north bangalore capital appreciation has not been uniform - it has concentrated where infrastructure and social base arrived together. Yelahanka got both early.
What Supports the Next Five Years
Wider Bengaluru is forecast at roughly 10-12% price growth in 2026, with the airport corridor expected to run ahead of the city average. Namma Metro's Blue Line to the airport is under construction through this corridor rather than announced. Land values in the belt are projected to keep rising as that pipeline completes. Supply is the asymmetry: large low-density parcels inside the belt are effectively gone, and what remains is smaller and denser.
The Honest Caveats
A 21.5% year does not annualise. Percentage growth from a low base flatters, and this belt started low - Rs 4,200 a sft in 2019 is not a number that repeats its multiple. Yelahanka real estate growth from here works off a materially higher base, which mathematically caps the headline rates achievable. Anyone modelling the next decade at 20% a year is modelling fiction.
What Would Break the Trend
Three risks deserve naming. Metro delivery slipping materially would delay the second repricing that rail usually triggers. A supply surge from township-scale land at Devanahalli could absorb demand that would otherwise concentrate here. And a broader correction in Bengaluru would not spare a corridor simply because its fundamentals are good. None of these is predicted; all of them are possible.
Using the Trend Properly
Treat it as evidence of direction rather than a forecast of magnitude. The corridor has employment at both ends, an international airport in the middle, a metro line being built and land that has largely gone. That combination supports continued growth without promising a rate. Buy on the structure, not on the percentage, and hold long enough for the structure to work.
What the Trend Does Not Tell You
Averages hide more than they reveal in a belt this uneven. The Yelahanka property price appreciation trend of roughly 21.5% is a locality-level figure covering apartments, plots and villas at once. Your specific asset may have run far ahead of it or well behind, depending on format, position and developer. Treat the headline as weather rather than as a forecast for your own plot.
Format matters most. Villa rates across the belt trebled from about Rs 4,200 a sft in 2019 to roughly Rs 12,000 because low-density land became genuinely scarce. Apartment rates moved less, because apartments can be built upward on a smaller footprint and supply responded. Same corridor, same infrastructure, different physics.
How to Use a Trend Line
Three rules. Never annualise a single year. Always ask what the base was, because a trebling from Rs 4,200 says nothing about what happens from Rs 12,000. And check whether the driver is still operating - the airport landed and cannot land twice, but the metro has not opened yet and the aerospace belt is still hiring. Growth from here depends on the drivers that remain rather than the ones already priced in.
Related Articles

Bangalore, GCC Capital: What It Means for Property Investors
Bangalore's GCC expansion is boosting North Bengaluru through leadership hiring, airport connectivity and sustained housing demand, making Bettahalasuru attractive for long-term villa investment.

Bangalore Smart City Initiatives & Their Real Estate Impact
Bangalore's smart city impact is driven by completed infrastructure, not announcements. North Bengaluru benefits from the airport, metro construction and road connectivity.
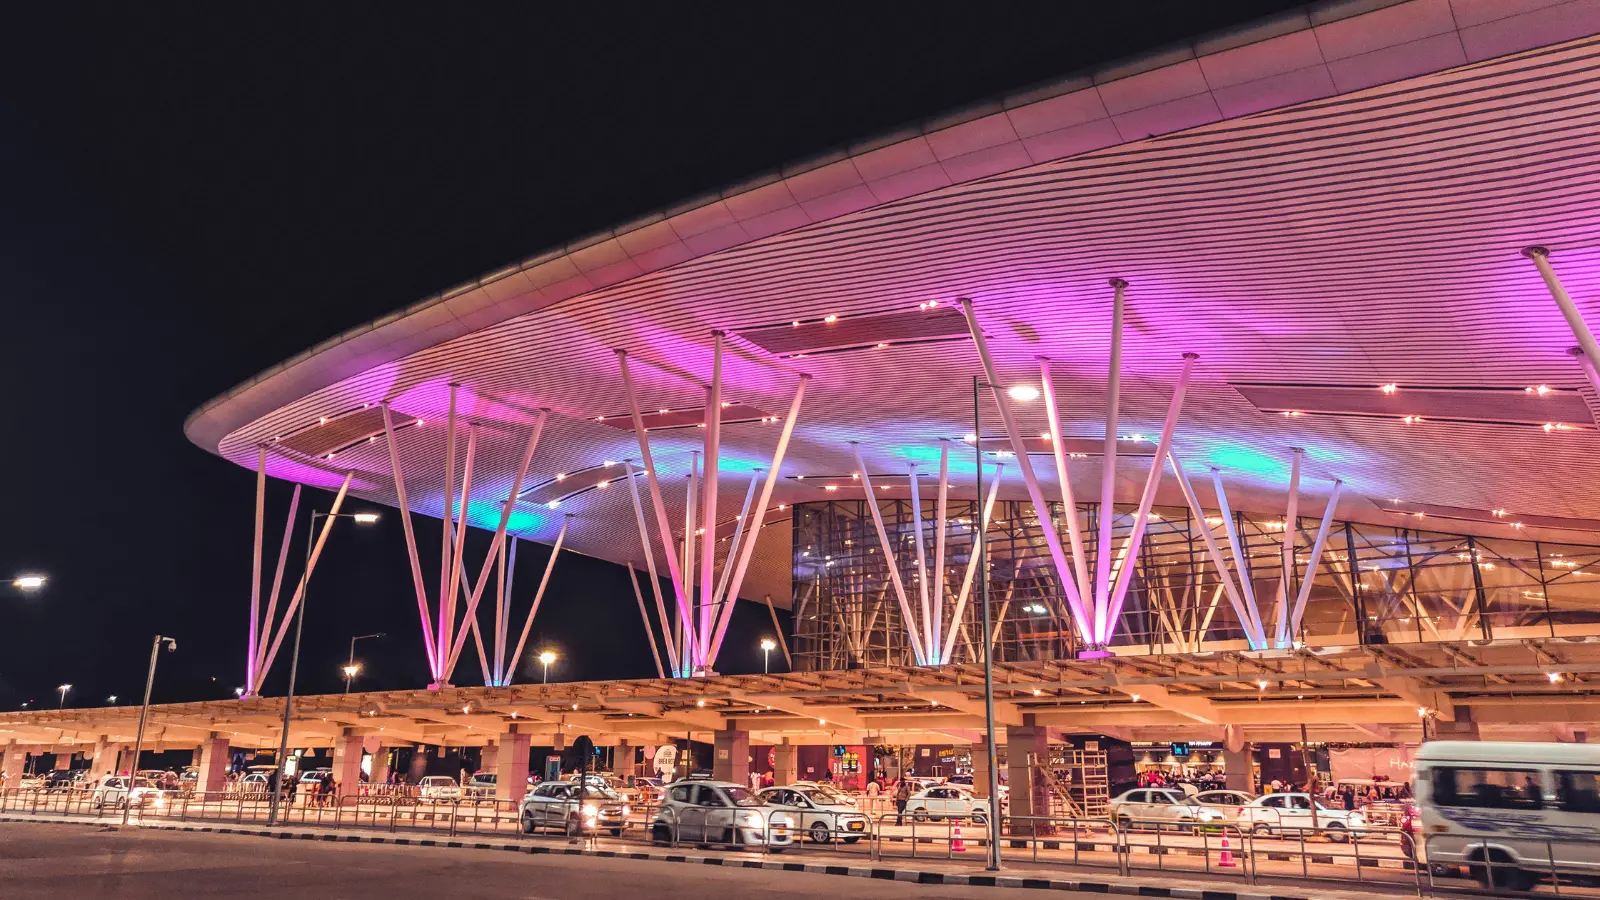
The Airport Economy: How KIA Is Reshaping North Bangalore
Bangalore Airport is driving North Bengaluru's growth through jobs, infrastructure and housing demand. Bettahalasuru benefits from this expanding airport economy, making it a strategic residential location.

How Bangalore's IT Boom Keeps Driving Real Estate Demand
Bangalore's IT boom continues to shape North Bengaluru through employment, airport-led growth and diversified industries, strengthening long-term housing demand around Bettahalasuru.